
What Is Firmographic Data? (The Ultimate Guide to B2B Targeting)
Imagine trying to sell industrial-grade snow shovels. You have the perfect pitch and a brilliant product. But you spend all your time calling businesses in Miami.
That is what selling in B2B feels like without firmographic data.
You might have a great offer, but if you are targeting companies that are too small, in the wrong industry, or located in a region you cannot service, your sales pipeline will dry up fast.
Firmographics are the foundation of every successful B2B go-to-market strategy. They tell you exactly who has the budget, the need, and the right structural fit for your product.
In this comprehensive guide, I will break down exactly what firmographic data is, how to use it for segmentation, and how to combine it with modern intent data to build an unstoppable revenue engine.
What Are Firmographics?
Firmographic data is a set of descriptive attributes used to categorize and segment organizations, companies, and non-profits.
Just like B2C marketers use demographics (age, gender, income) to understand individual consumers, B2B marketers and sales teams use firmographics to understand businesses. It is the core component of B2B data that helps you define your target market.
When you look at a company, firmographics answer the basic foundational questions:
- What do they do?
- How big are they?
- Where are they located?
- How much money do they make?
Without this baseline data, B2B sales and marketing teams are effectively flying blind, wasting ad spend and sales hours on companies that will never buy.
Demographics vs. Firmographics: The Core Difference
People often confuse these two terms, but the distinction is simple. Demographics apply to people. Firmographics apply to companies.
| Feature | Demographics (B2C & B2B Personas) | Firmographics (B2B Accounts) |
| Subject | Individual humans | Organizations and businesses |
| Examples | Age, gender, income, education level | Industry, revenue, headcount, location |
| Use Case | Targeting a specific type of buyer (e.g., VP of Sales) | Targeting a specific type of account (e.g., Enterprise SaaS) |
If you sell enterprise software, you need both. You use firmographic data to find the right company, and demographic data to find the right decision-maker inside that company.
The 7 Key Types of Firmographic Data (With Practical Examples)
Not all firmographic variables are created equal. Depending on what you sell, certain data points will make or break your ideal customer profile.
Here are the seven standard types of firmographic data you need to build your target lists.
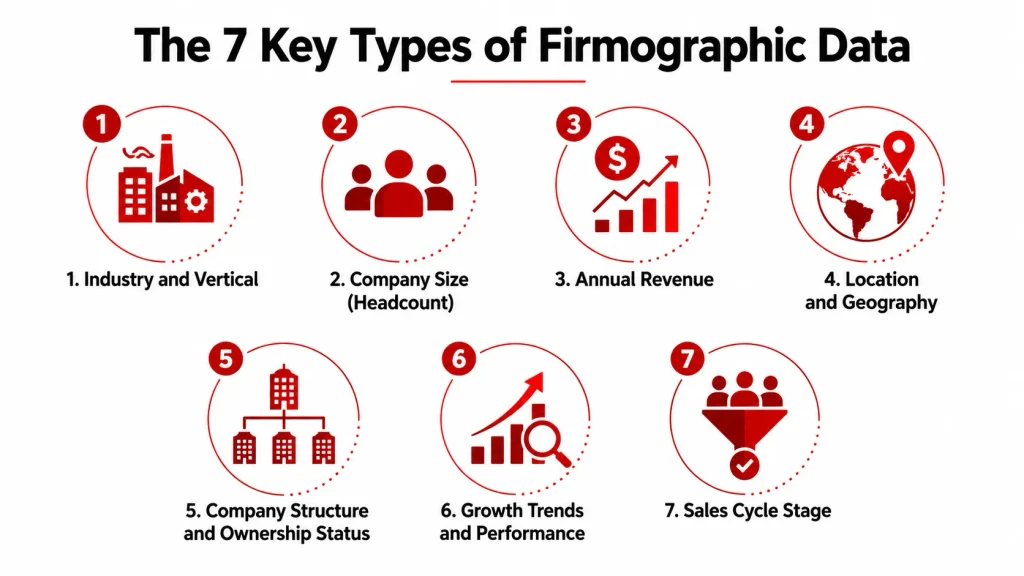
1. Industry and Vertical
Knowing what a company does is step one. Industry data allows you to group companies by their core business activities.
Historically, this was done using rigid government classification systems:
- SIC Codes (Standard Industrial Classification)
- NAICS Codes (North American Industry Classification System)
While NAICS codes are still used for broad categorization, they are often too generic for modern B2B targeting. For example, “Software Publishers” (NAICS 511210) includes everything from a two-person mobile gaming studio to Microsoft.
Pro Tip: Look for data providers that offer custom industry tagging or keyword-based categorization so you can target niche verticals like “Fintech,” “PropTech,” or “Cybersecurity.”
2. Company Size (Headcount)
Company size is usually measured by the total number of full-time employees. This metric drastically changes how you sell, what you charge, and who you talk to.
A startup with 15 employees moves fast and might buy your software with a credit card after a single demo. An enterprise with 15,000 employees requires security reviews, legal red tape, and a six-month sales cycle.
Common Headcount Tiers:
- SMB (Small & Medium Business): 1 – 99 employees
- Mid-Market: 100 – 999 employees
- Enterprise: 1,000+ employees
3. Annual Revenue
Revenue dictates buying power. If your product has an annual contract value (ACV) of $50,000, you cannot afford to prospect into companies generating $500,000 a year in total revenue.
Revenue data helps your sales team immediately disqualify accounts that simply lack the budget. Keep in mind that for private companies, revenue data is often estimated by third-party data providers rather than stated as a hard fact.
4. Location and Geography
Where a company operates impacts language, currency, legal compliance, and time zones.
For a local IT service provider, location is a hard filter (e.g., “We only service companies within 50 miles of Chicago”). For a global SaaS company, location dictates which regional sales rep gets the account.
Key geographical data points include:
- Headquarters location
- Number of secondary offices
- Employee distribution (are they a fully remote, global workforce?)
5. Company Structure and Ownership Status
Understanding how a company is built helps you navigate the purchasing process. A privately owned family business makes decisions differently than a publicly traded corporation beholden to shareholders.
- Public vs. Private: Public companies have strict procurement processes but publicly available financial data. Private companies move faster but hide their financials.
- Parent Companies and Subsidiaries: If you close a deal with a subsidiary brand, you can use that leverage to sell into the parent company.
- Non-profits and Government: These require entirely different sales motions and pricing structures.
6. Growth Trends and Performance
This is where firmographic data gets dynamic. Static data tells you how big a company is today. Trend data tells you where they are going tomorrow.
Look for signals like:
- Hiring velocity (Are they aggressively hiring SDRs? They might need a new dialer tool).
- Recent funding rounds (Series A, Series B).
- Layoffs and downsizing.
A company that just raised $20M in Series B funding is a prime target. They have fresh capital and a mandate to grow, making them highly receptive to new lead generation strategies and software tools.
7. Sales Cycle Stage
Are they an existing customer? A cold prospect? A lost opportunity from last year?
Your internal CRM data acts as a vital layer of firmographics. Grouping accounts by their current relationship with your business prevents you from accidentally cold-calling your best customers.
Why Firmographic Data Drives B2B Revenue
Collecting this data is not just an administrative exercise for operations teams. It is the fuel that powers your entire Go-To-Market strategy. Here is exactly how high-performing revenue teams leverage firmographics.
1. Sharpening Your Ideal Customer Profile (ICP)
Your ICP is a fictitious company that represents your absolute best customer—the ones who cost the least to acquire, stay with you the longest, and get the most value from your product.
You cannot build an ICP using gut feelings. You build it using firmographic data. By analyzing your top 20% of existing customers, you might discover that your true ICP is: B2B SaaS companies (Industry), with 50-200 employees (Size), generating $10M-$50M in revenue (Revenue), located in North America (Geography).
Once you know this, you can ignore everyone else.
2. Powering Account-Based Marketing (ABM)
If you are running an account-based marketing playbook, firmographics are non-negotiable.
ABM flips the traditional marketing funnel upside down. Instead of casting a wide net and seeing who fills out a form, you start with a highly specific list of target companies and pursue them relentlessly. You cannot build a prospect list for ABM without filtering by firmographic variables like revenue, size, and industry.
3. Improving Lead Routing and Scoring
When an inbound lead downloads an ebook, how do you know if they should go to a junior rep or your most senior Enterprise Account Executive?
Lead routing relies on firmographics. If a lead uses a company email address routing to a 5,000-person company, your CRM can automatically route that lead to the Enterprise team. If the company has 10 employees, it goes to the SMB team. This ensures the right reps talk to the right accounts instantly, reducing friction and speeding up the sales cycle.
4. Smarter Sales Territory Planning
Sales leaders use firmographic data to carve up territories evenly. Instead of just dividing the map by state lines, smart leaders use data to ensure every rep gets an equal piece of the total addressable market (TAM).
If California has 5,000 companies that fit your ICP, but North Dakota only has 10, assigning one rep to each state is a recipe for disaster. Firmographics allow you to balance territories based on account density and revenue potential.
How to Collect Accurate Firmographic Data
You know what firmographics are and why you need them. So, where do you actually get this data?
There are four primary avenues to enrich your database.
1. Zero-Party Data (Forms and Surveys)
The most accurate data comes directly from the prospect. When a user requests a demo on your website, you can ask them for their company name, employee count, and industry via drop-down menus on the lead form.
- Pros: Highly accurate and free.
- Cons: Longer forms lower your conversion rates. If you ask a prospect for 10 pieces of firmographic data just to download a PDF, they will abandon the page.
2. First-Party Data (Sales Interactions)
Your sales team is a data collection engine. During discovery calls, reps naturally uncover details about company structure, revenue goals, and growth plans.
The challenge here is discipline. Revenue operations teams must ensure that sales reps actually log this data into the CRM correctly, rather than leaving it buried in unstructured call notes.
3. Third-Party Sales Intelligence Platforms
This is how modern B2B teams operate. Instead of making buyers fill out long forms, they use data vendors to automatically enrich leads behind the scenes.
When a prospect enters just their business email on your site, a sales intelligence tool (like ZoomInfo, Apollo, Clearbit, or Cognism) instantly pings a database and populates your CRM with their industry, headcount, revenue, and location.
- Pros: Scales massively, keeps inbound forms short, and builds massive outbound lists in seconds.
- Cons: Data can sometimes be outdated, and premium platforms are expensive.
4. Public Records & LinkedIn
If you are bootstrapping, you can collect firmographic data manually. LinkedIn is the world’s largest firmographic database. By visiting a company’s LinkedIn page, you can instantly see their employee count, location, and industry.
While manual research is great for highly targeted ABM campaigns, it is impossible to scale if you are trying to reach thousands of accounts a month.
The Firmographic Blind Spot: Data Decay
Here is the dirty secret of the B2B data industry: Data rots incredibly fast.
Companies get acquired, they go bankrupt, they lay off 30% of their staff, or they pivot into new industries. In fact, standard B2B CRM data decays at a rate of roughly 30% per year.
If you buy a static list of 10,000 “Mid-Market Healthcare Companies” and let it sit in a spreadsheet for a year, a massive chunk of that list will be useless by the time you email them.
To combat data decay, you must integrate live data enrichment into your CRM. Don’t rely on one-time list pulls. Ensure your systems constantly refresh firmographic data so your sales team is never working with obsolete information.
Going Beyond Firmographics: The 3D Data Model
Here is the most important takeaway of this guide: Firmographics are necessary, but they are no longer sufficient to close deals on their own.
If you rely only on firmographic data, you will end up pitching companies that fit your profile perfectly, but have absolutely zero interest in buying what you sell right now.
To build a modern, high-converting revenue engine, you need to combine firmographics with two other layers of data. This creates a “3D” profile of your buyer.
Layer 1: Firmographics (The “Who”)
- Does this company fit our ideal size, industry, and revenue criteria?
- Example: A SaaS company with 200 employees.
Layer 2: Technographics (The “How”)
- What software and hardware does this company already use?
- Technographic data tells you if a company is compatible with your product. If you sell a Salesforce integration, targeting a firmographically perfect company that uses HubSpot is a waste of time.
- Example: A SaaS company with 200 employees that currently uses Salesforce and Outreach.
Layer 3: Intent Data (The “When”)
- Is this company actively researching a solution like ours right now?
- Intent data tracks online behavior (like reading articles on third-party review sites or searching specific keywords). It tells you who is in the market to buy today.
- Example: A SaaS company with 200 employees, using Salesforce, that is currently reading reviews about your direct competitors.
When you layer firmographics, technographics, and intent data together, you stop cold-calling randomly. You reach out to the right company, with the right tech stack, at the exact moment they are looking to buy.
The Future: AI and Firmographic Data
The collection and application of firmographic data is currently undergoing a massive shift thanks to artificial intelligence.
Historically, data vendors relied on manual web scraping and call centers to verify company information. Today, AI lead generation tools can ingest millions of unstructured data points—from press releases, podcast transcripts, and job postings—to create real-time, dynamic company profiles.
AI isn’t just telling you how many employees a company has. It is analyzing their recent job postings to tell you what departments they are expanding. It is reading their quarterly earnings calls to identify their strategic priorities for the next six months.
As AI continues to integrate into GTM workflows, firmographic data will move from being a static snapshot of a company to a live, breathing narrative of an account’s health and trajectory.
A Practical Firmographic Scoring Matrix (Action Step)
Do not just read this and move on. Here is a practical way to apply this concept today. Build a Firmographic Scoring Matrix to prioritize your sales outreach.
Assign point values to different firmographic attributes based on your historical win rates.
Example Matrix:
- Industry: Software (+10 pts), Financial Services (+5 pts), Retail (-5 pts)
- Headcount: 100-500 employees (+10 pts), 50-99 employees (+5 pts), under 50 (-10 pts)
- Funding: Recently raised capital (+15 pts), Bootstrapped (0 pts)
Once you set up these rules in your CRM, every incoming lead gets a score. Your sales reps can simply sort their daily task list by the highest firmographic score, ensuring they spend their prime selling hours on the accounts mathematically most likely to close.
Summary
Firmographic data is the compass that guides your B2B go-to-market strategy. Without it, you are simply guessing.
By understanding the key variables—industry, size, revenue, location, structure, and growth trends—you can ruthlessly filter out bad fit accounts, tighten your ICP, and give your sales team the focus they need to drive serious revenue.
Just remember to keep your data clean, combat decay, and eventually layer on technographic and intent data to truly master modern outbound sales.
Frequently Asked Questions About Firmographic Data
What is the exact difference between firmographic data and demographic data in B2B?
Firmographics describe companies, while demographics describe people. When I build a B2B target list, I use firmographics to find the right business. I look at company size, industry, and revenue. Then, I use demographics to find the right person inside that company. I check their job title and seniority. You need both to win. Firmographics pick the account, and demographics shape the pitch.
How does technographic data differ from firmographic data?
Firmographic data tells me what a company is, while technographic data tells me what software they use. Firmographics track basic facts, like employee count and location. Technographics track the tech stack. This includes their CRM, email tools, or cloud host. I always mix both. This way, I know if a prospect’s current tools will actually work with my product.
Where do B2B companies actually source firmographic data from?
I pull firmographic data from three main places: my own forms, sales intelligence tools, and public records. First, I get it directly from my lead capture forms and CRM. Second, I buy it from third-party databases. These tools automatically add details to my lists. Finally, I check public sources. I look at LinkedIn, government sites, and SEC filings to verify the facts.
How does firmographic data power Account-Based Marketing (ABM)?
Firmographic data acts as the main filter I use to find high-value targets for ABM. In Account-Based Marketing, I do not chase broad groups. I use firmographics to pick a small list of companies. These companies must match my ideal customer profile perfectly. I filter by specific revenue and industry limits. This way, I only spend time on the accounts that can actually buy.
Is firmographic data more important than intent data?
They both matter equally, but they answer different questions: firmographics tell me who fits, and intent data tells me who is ready to buy. A company might look perfect on paper. But if they do not want to buy yet, my cold call will fail. I use firmographic data to build a strong list. Then, I use intent data to reach out exactly when they start searching for a solution.